Percentage of Singles by Age: Key Statistics
Updated:
Open Access
About 42% of U.S. adults are unpartnered overall. Single rates are highest among young adults, with nearly 86% of those ages 18 to 24 not living with a partner. Among adults ages 65 and older, about 41% are also unpartnered.
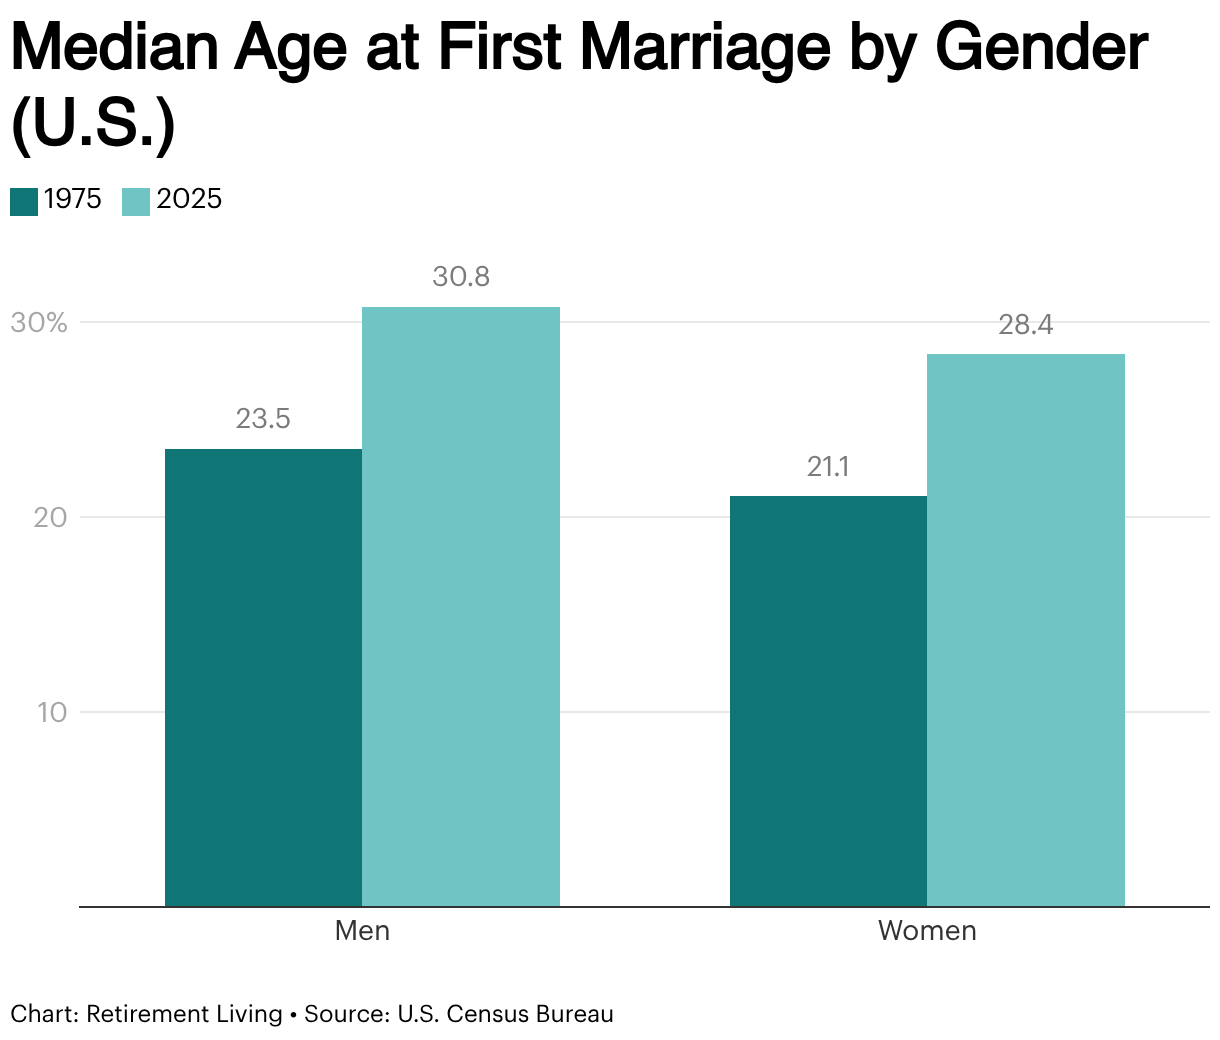
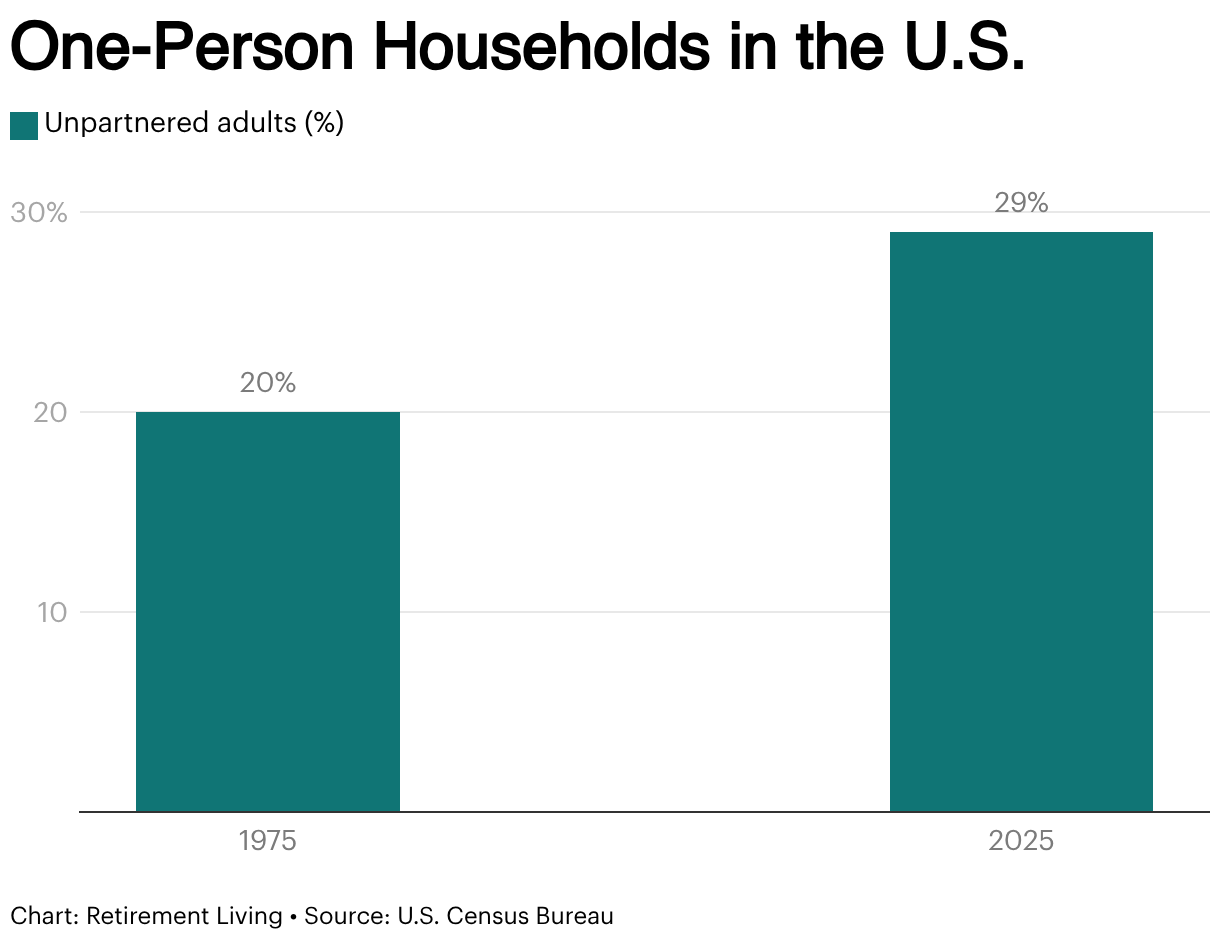
One reason is that marriage now happens later in life. The median age at first marriage is 30.8 for men and 28.4 for women. As a result, married couples made up 47% of U.S. households in 2025, down from 66% in 1975. At the same time, adults living alone rose to 29% of all households.

Key Insights
Singlehood peaks in early adulthood, with nearly nine in ten of 18–24 years-old unpartnered before rates drop sharply by midlife.
↓ Jump to insight
The eight-year rise in the median age at first marriage since 1975 shows that adults now marry for the first time later and remain single longer.
↓ Jump to insight
Men are more likely to be unpartnered before age 40, while women dominate singlehood after 65 due to widowhood and lower remarriage rates.
↓ Jump to insight
Partnership rates differ by background, with 44% of U.S.-born adults unpartnered compared with 33% of foreign-born adults.
↓ Jump to insight
Nearly three in ten U.S. households now consist of one person, driven in part by growth among adults ages 65 and older.
↓ Jump to insight
Percentage of Singles by Age in the U.S.
Single rates change sharply by age. Young adults have the highest share of unpartnered people. That share drops by midlife, falling to about 29% among adults ages 40 to 54. Marriage and cohabitation become more common during these years.

How Singlehood Changes From Young Adulthood to Midlife
Since 1975, the median age at first marriage rose by about eight years for both men and women.
As marriage moved later, cohabitation increased modestly. The share of adults living with an unmarried partner increased by 1 percentage point between 2019 and 2023. Marriage increased by the same 1 percentage point during that period.
Living arrangements also differ by age. About 58% of adults ages 18 to 24 live with parents, compared with 16% of adults ages 25 to 34. This gap reflects delayed partnering during early adulthood.
Gender Differences in Singlehood by Age
Men under age 40 are more likely to be unpartnered than women. Later marriage among men also shapes senior dating patterns later in life.
After age 65, the pattern reverses. Widowhood becomes more common among older women, and fewer remarry after a spouse’s death.

Race and Ethnicity Differences in Single Americans
Singlehood differs across racial and ethnic groups in the U.S. Nativity also shapes partnership status. About 44% of U.S.-born adults are unpartnered, compared with 33% of foreign-born adults.

Educational Attainment and Singlehood in Women
In 2023, about four million women ages 15 to 50 gave birth. Of the 1.2 million single women who were unmarried, 35.5% lived with an unmarried partner, showing that many formed households outside marriage.
Education level also affects unmarried birth rates. In 2023, about 49% of women without a high school diploma and 48% of high school graduates or GED holders with a recent birth were unmarried. In 2011, the share among women without a high school diploma was 57%, showing a clear decline over time.
During this period, the share of women with a recent birth holding a bachelor’s degree rose from 8.8% to 11.4%.
Living Arrangements of Single Adults
Among adults ages 25 to 54, unpartnered adults earn less than those living with a spouse or partner. Employment gaps follow the same pattern. Single men are less likely to be employed than partnered men.
Financial stability also differs by partnership status. In 2024, 64% of unpartnered adults said they were doing at least OK financially. Among partnered adults, 77% reported the same. These gaps shape housing choices and later-life relationship decisions, including senior dating.
Living Alone vs. Living With Others
Living alone has become more common in the U.S. In 2025, 39.7 million households had one person, accounting for 29% of all U.S. households. Age plays a central role in this pattern. Adults ages 65 and older now make up more than one-quarter of all householders, showing how single living rises later in life.
Cohabiting but Not Married
Only 7% of adults now live with an unmarried partner, with higher rates among adults under age 50. However, around 58% of adults and 42% of practicing Christians view living together before marriage as wise.
Single Parents and Relationship Status
Single parenthood remains closely tied to relationship status at the time of birth. This pattern is most pronounced among younger parents. In 2023, 90.1% of births to women ages 15 to 19 occurred outside marriage.
While the share remains high, the number of unmarried teen births declined sharply over time. Births to unmarried teens fell from 216,436 in 2011 to 82,530 in 2023.
Dating, Relationships, and Single Life Today
About 78% of Gen Z and 73% of Millennials say they hope to marry. At the same time, younger people place less emphasis on marriage as a requirement for raising children.
Marriage patterns shift with age. As Millennials age, marriage rates rise, with about 42% now married and only 5% divorced. Boomers show a different pattern. About 30% have divorced, the highest share of any generation.
These patterns also shape later-life dating, where awareness of senior dating scams has become more important as more older adults reenter the dating world.
Online Dating and Social Media
About 30% of U.S. adults have used a dating site or app. Usage is highest among younger adults, with 53% of adults under 30 having tried online dating, compared with 37% of adults ages 30 to 49. Usage declines at older ages, though senior dating continues as more older adults remain single.
Purpose also varies by romantic relationship status. About 44% of users seek a serious relationship, while 24% use apps mainly for casual dating. Never-married adults are the most active users, with 52% having tried online dating, compared with 16% of married adults. Same-sex couples are also more likely to meet online than heterosexual couples.
Bottom Line
Being single has become a long-term reality for many adults in the U.S. Marriage now happens later, and fewer people marry overall. The U.S. marriage rate is projected to drop to 5.8 marriages per 1,000 people, continuing a steady decline after a brief post-pandemic bump.
As marriage slows, more adults remain single through young and midlife. Some live alone. Others cohabit without marrying. These patterns show that singlehood is no longer just a short phase before marriage. It is a common and stable way adults live today.
Fair Use Statement
If you have experience with senior dating or online dating later in life, we’d like to hear from you. Share your insights at [email protected]. Your personal details will remain confidential.
Sources
- Pew Research Center. Share of U.S. Adults Living Without a Romantic Partner Has Ticked Down in Recent Years. Evaluated January 29, 2026.
Link Here - Federal Reserve. Survey of Household Economics and Decisionmaking (SHED), 2024. Evaluated January 29, 2026.
Link Here - U.S. Census Bureau. America’s Families and Living Arrangements (Current Population Survey, 1975–2025). Evaluated January 29, 2026.
Link Here - U.S. Census Bureau. Social and Economic Characteristics of Currently Unmarried Women With a Recent Birth.Evaluated January 29, 2026.
Link Here - U.S. Census Bureau. Historical Marital Status Tables (CPS ASEC). Evaluated January 29, 2026.
Link Here - Barna Group. The State of Today’s Family Report. Evaluated January 29, 2026.
Link Here - Wheatley Institute at Brigham Young University, Center for the Study of Elections and Democracy at BYU, and Deseret News. American Family Survey, 2025. Evaluated January 29, 2026.
Link Here - IBISWorld. U.S. Marriage Rate Industry Data, 2025. Evaluated January 29, 2026.
Link Here